 IntroI have been more than casually following the developments of the new strain of the Coronavirus, especially from the alt-media perspective, given the obvious amounts of damage control going on in the mainstream media. Good resources so far have been Metokur, Molyneux has some good-ish stuff, JF, who did some really great work with an anon a week or so ago looking into the P-Shuttle SN theory, and BNO News. I was watching one of Molyneux's newest videos, where he read some Twitter thread, the link to which was broken. Anyway, this engineer or whatever claims that the number of infections doubles every six days, and had an initial US infection as of 6 Mar of 2000. This ignited my autism, and I left the following comment on the Molyneux video: 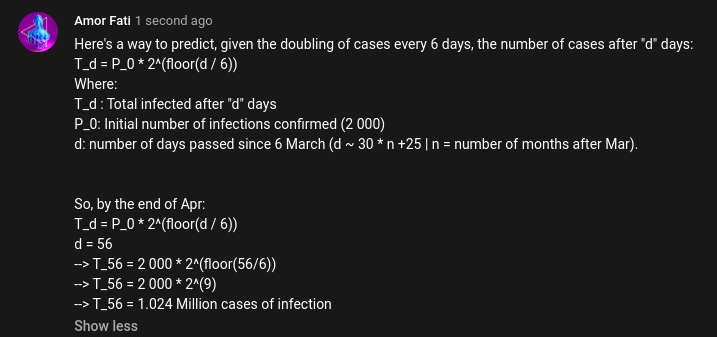 And here is the Molyneux stream with the proper timestamp to bring you goys up to speed: So We Looked at the Data...But I noticed a number of important problems with this model. First, the number of initial cases in the US at 2000 does not seem to be true, from BNO News, the number so far is about 434 as of 7 Mar: 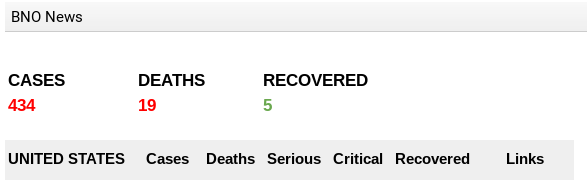 So that is a problem. The next problem I found was the doubling rate of the number of infections at 6 days. Perhaps that is a global number, I am not sure. The next bit of data was quite a challenge to find, and is a little precarious bit of data. It is hard to find consistent data of the numbers of Americans infected with the virus, and even harder to find a good timeline. So what I did instead was, using BNO's updates and number of infections for 7 Mar, added up the number of infections for 7 Mar, and then subtracted from the current number of cases. This left me with a number of 325 cases for 6 Mar. Back to my first equation for predicting growth based on the first model:  For d, we mean the number of days passed since 6 Mar. P0 = 325, and if we look at how many we should expect to see today:  That is quite the underestimation of the number of cases predicted by this model. This implies the doubling-rate has been actually underestimated. Granted, I am using very limited data points here. But to indulge myself a little, I wanted to use these few bits of data to try and develop a better model. I plan to not use this to cause alarm, I could be wrong given the limited data I have. I will also try to track the new numbers and update the doubling-rate more precisely. Also, as with any model, I am making a lot of assumptions. Assumptions include:
Model TwoThis out of the way, we can do some simple math to get a guess at the doubling-rate, r:  Which means, if current trends continue, we can expect a rate of doubling more than twice what was first given. Again, limited data points. Next, suppose we wanted to know about how many infections some number of days after 6 Mar could be expected in the US:  The Weatherman's Forecast Now, I would like to test my new model for precision. I can say, given the assumptions are basically reliable metrics, for Monday we can expect something like this:
I should also note for point 3, I was taking the difference. If I use the straight numbers based of the derivative of the original model, it predicts about 223 new cases for Monday. As the number of days from 6 Mar increases, the second model for the number of cases per day should be expected to become less accurate. Let us see how this prediction goes, - AF
0 Comments
Leave a Reply. |
AuthorI'm just trying to learn about everything I can. Archives
June 2020
Categories
All
|
 RSS Feed
